Swiss Drone and Okutama Drone Datasets
- Swiss Drone Dataset, with 100 images taken around Cheseaux-sur-Lausanne in Switzerland, at a flight height of around 80 meters
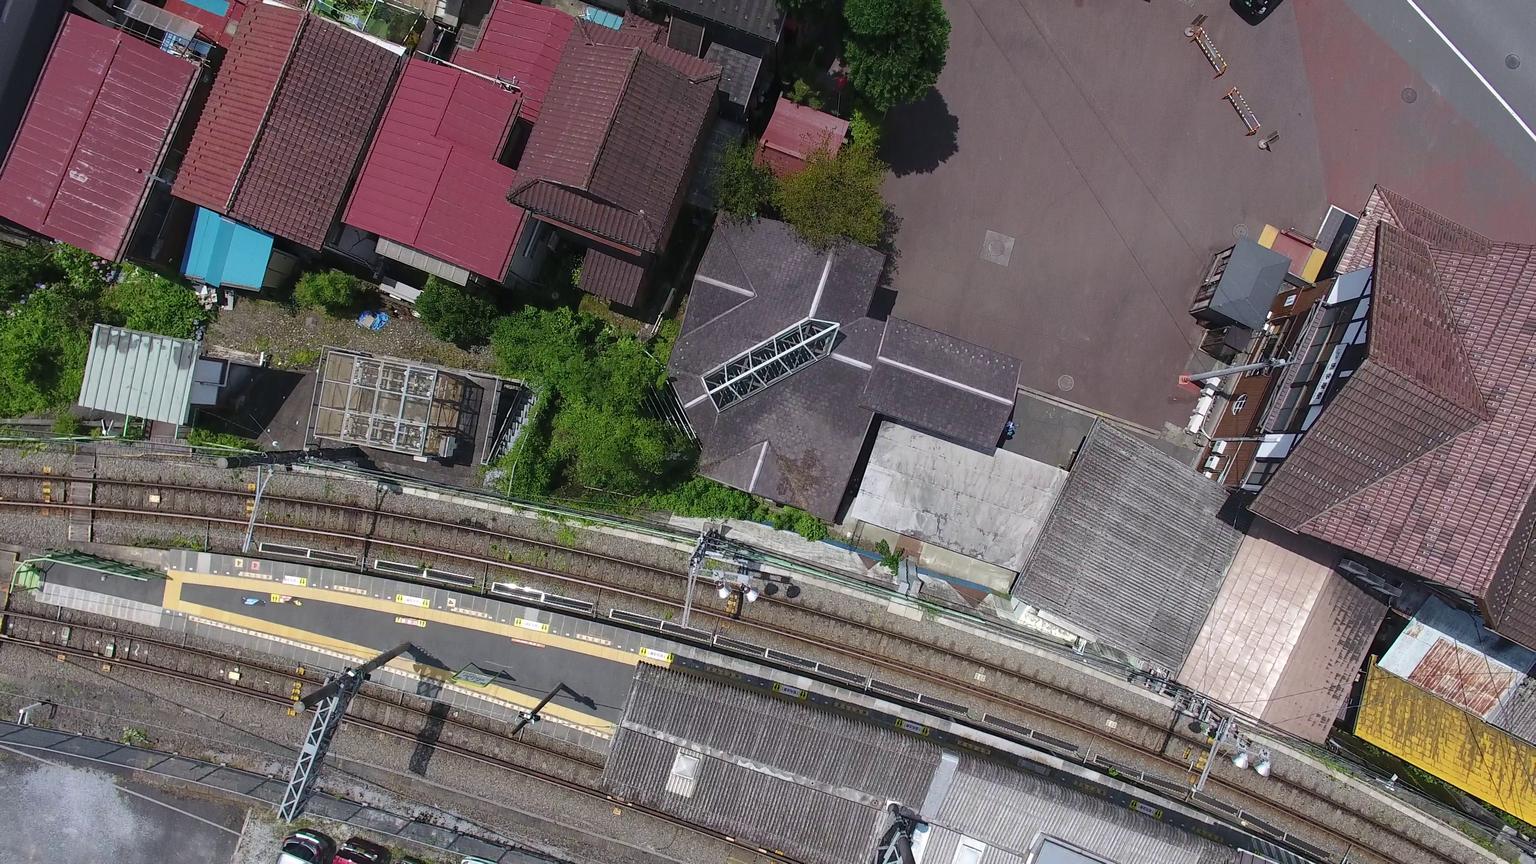
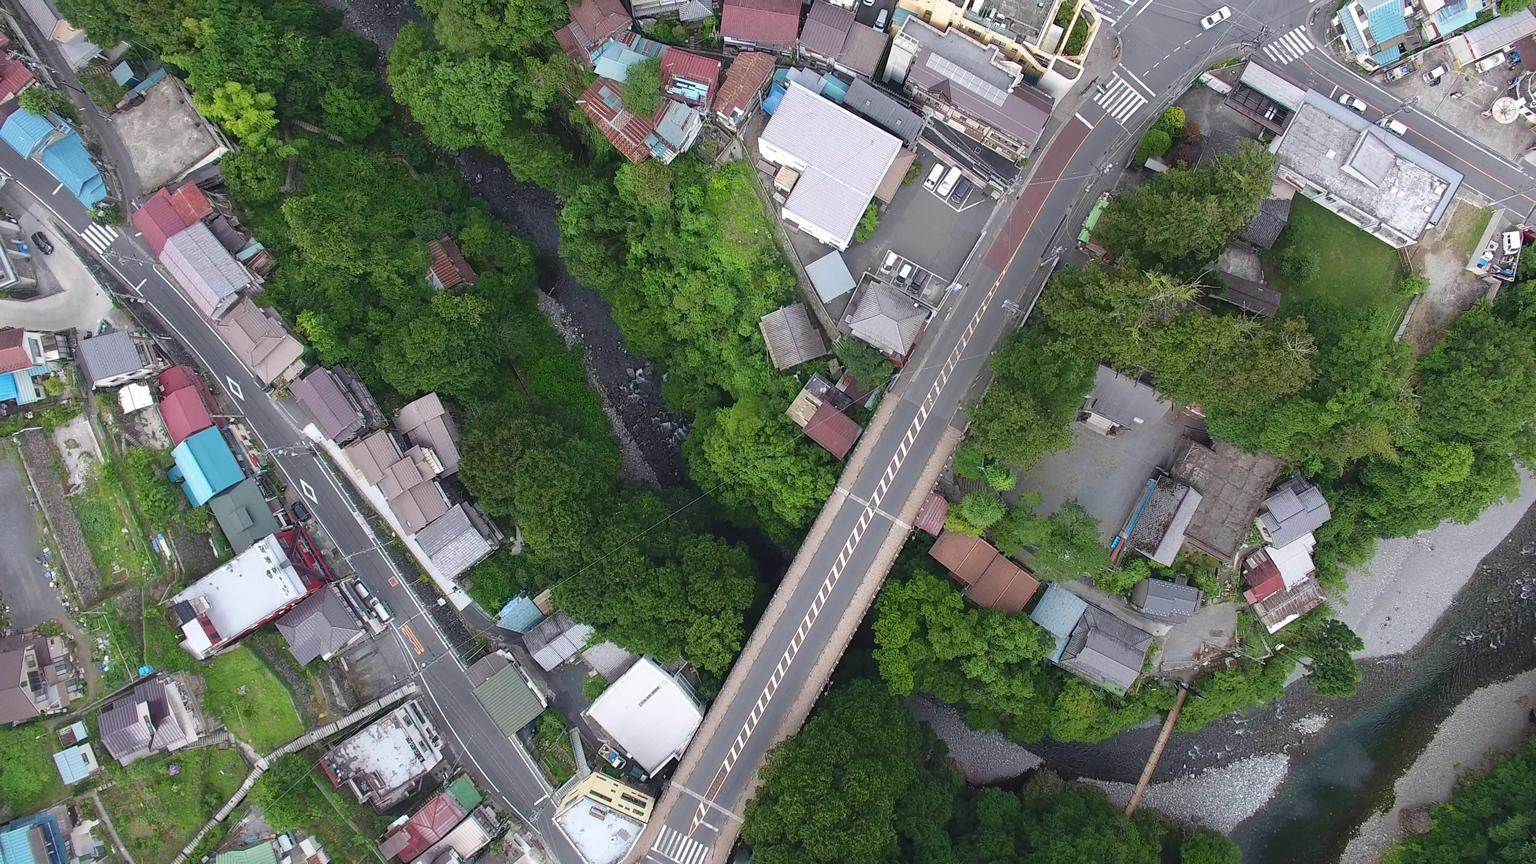
- Okutama Drone Dataset, with 91 images taken around Okutama, west of Tokyo, Japan, flying at a height of around 90 meters
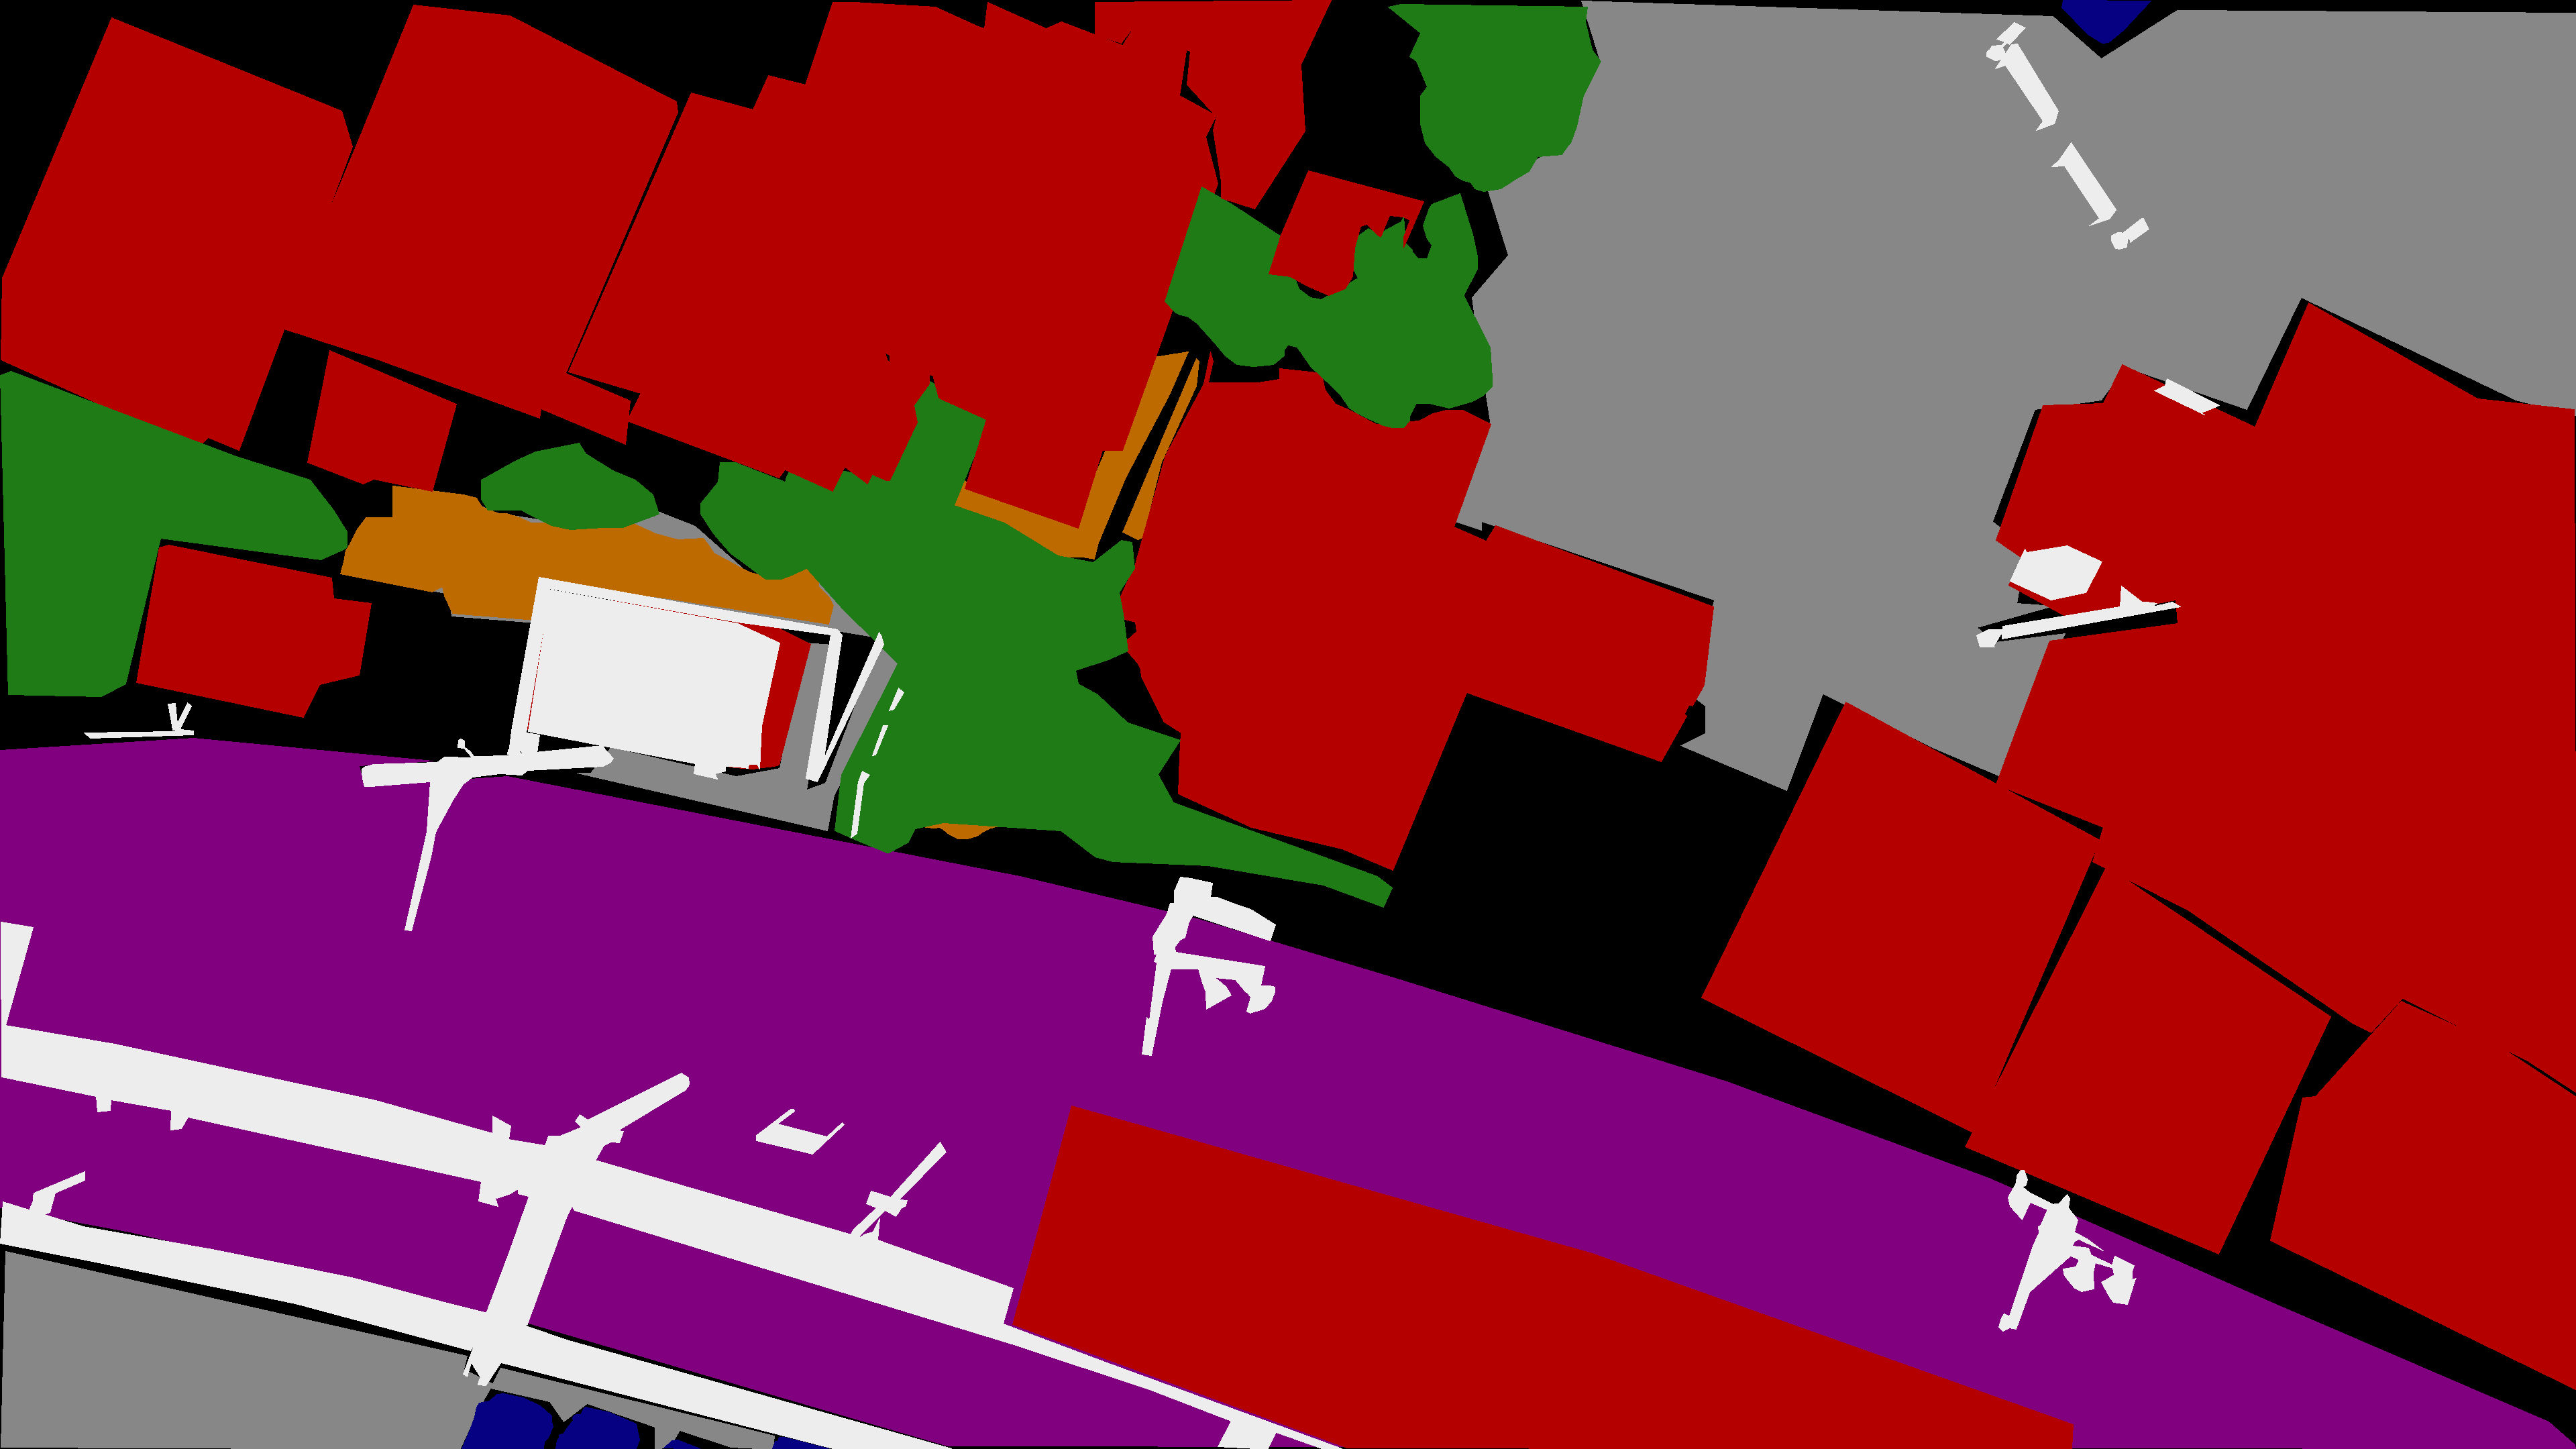
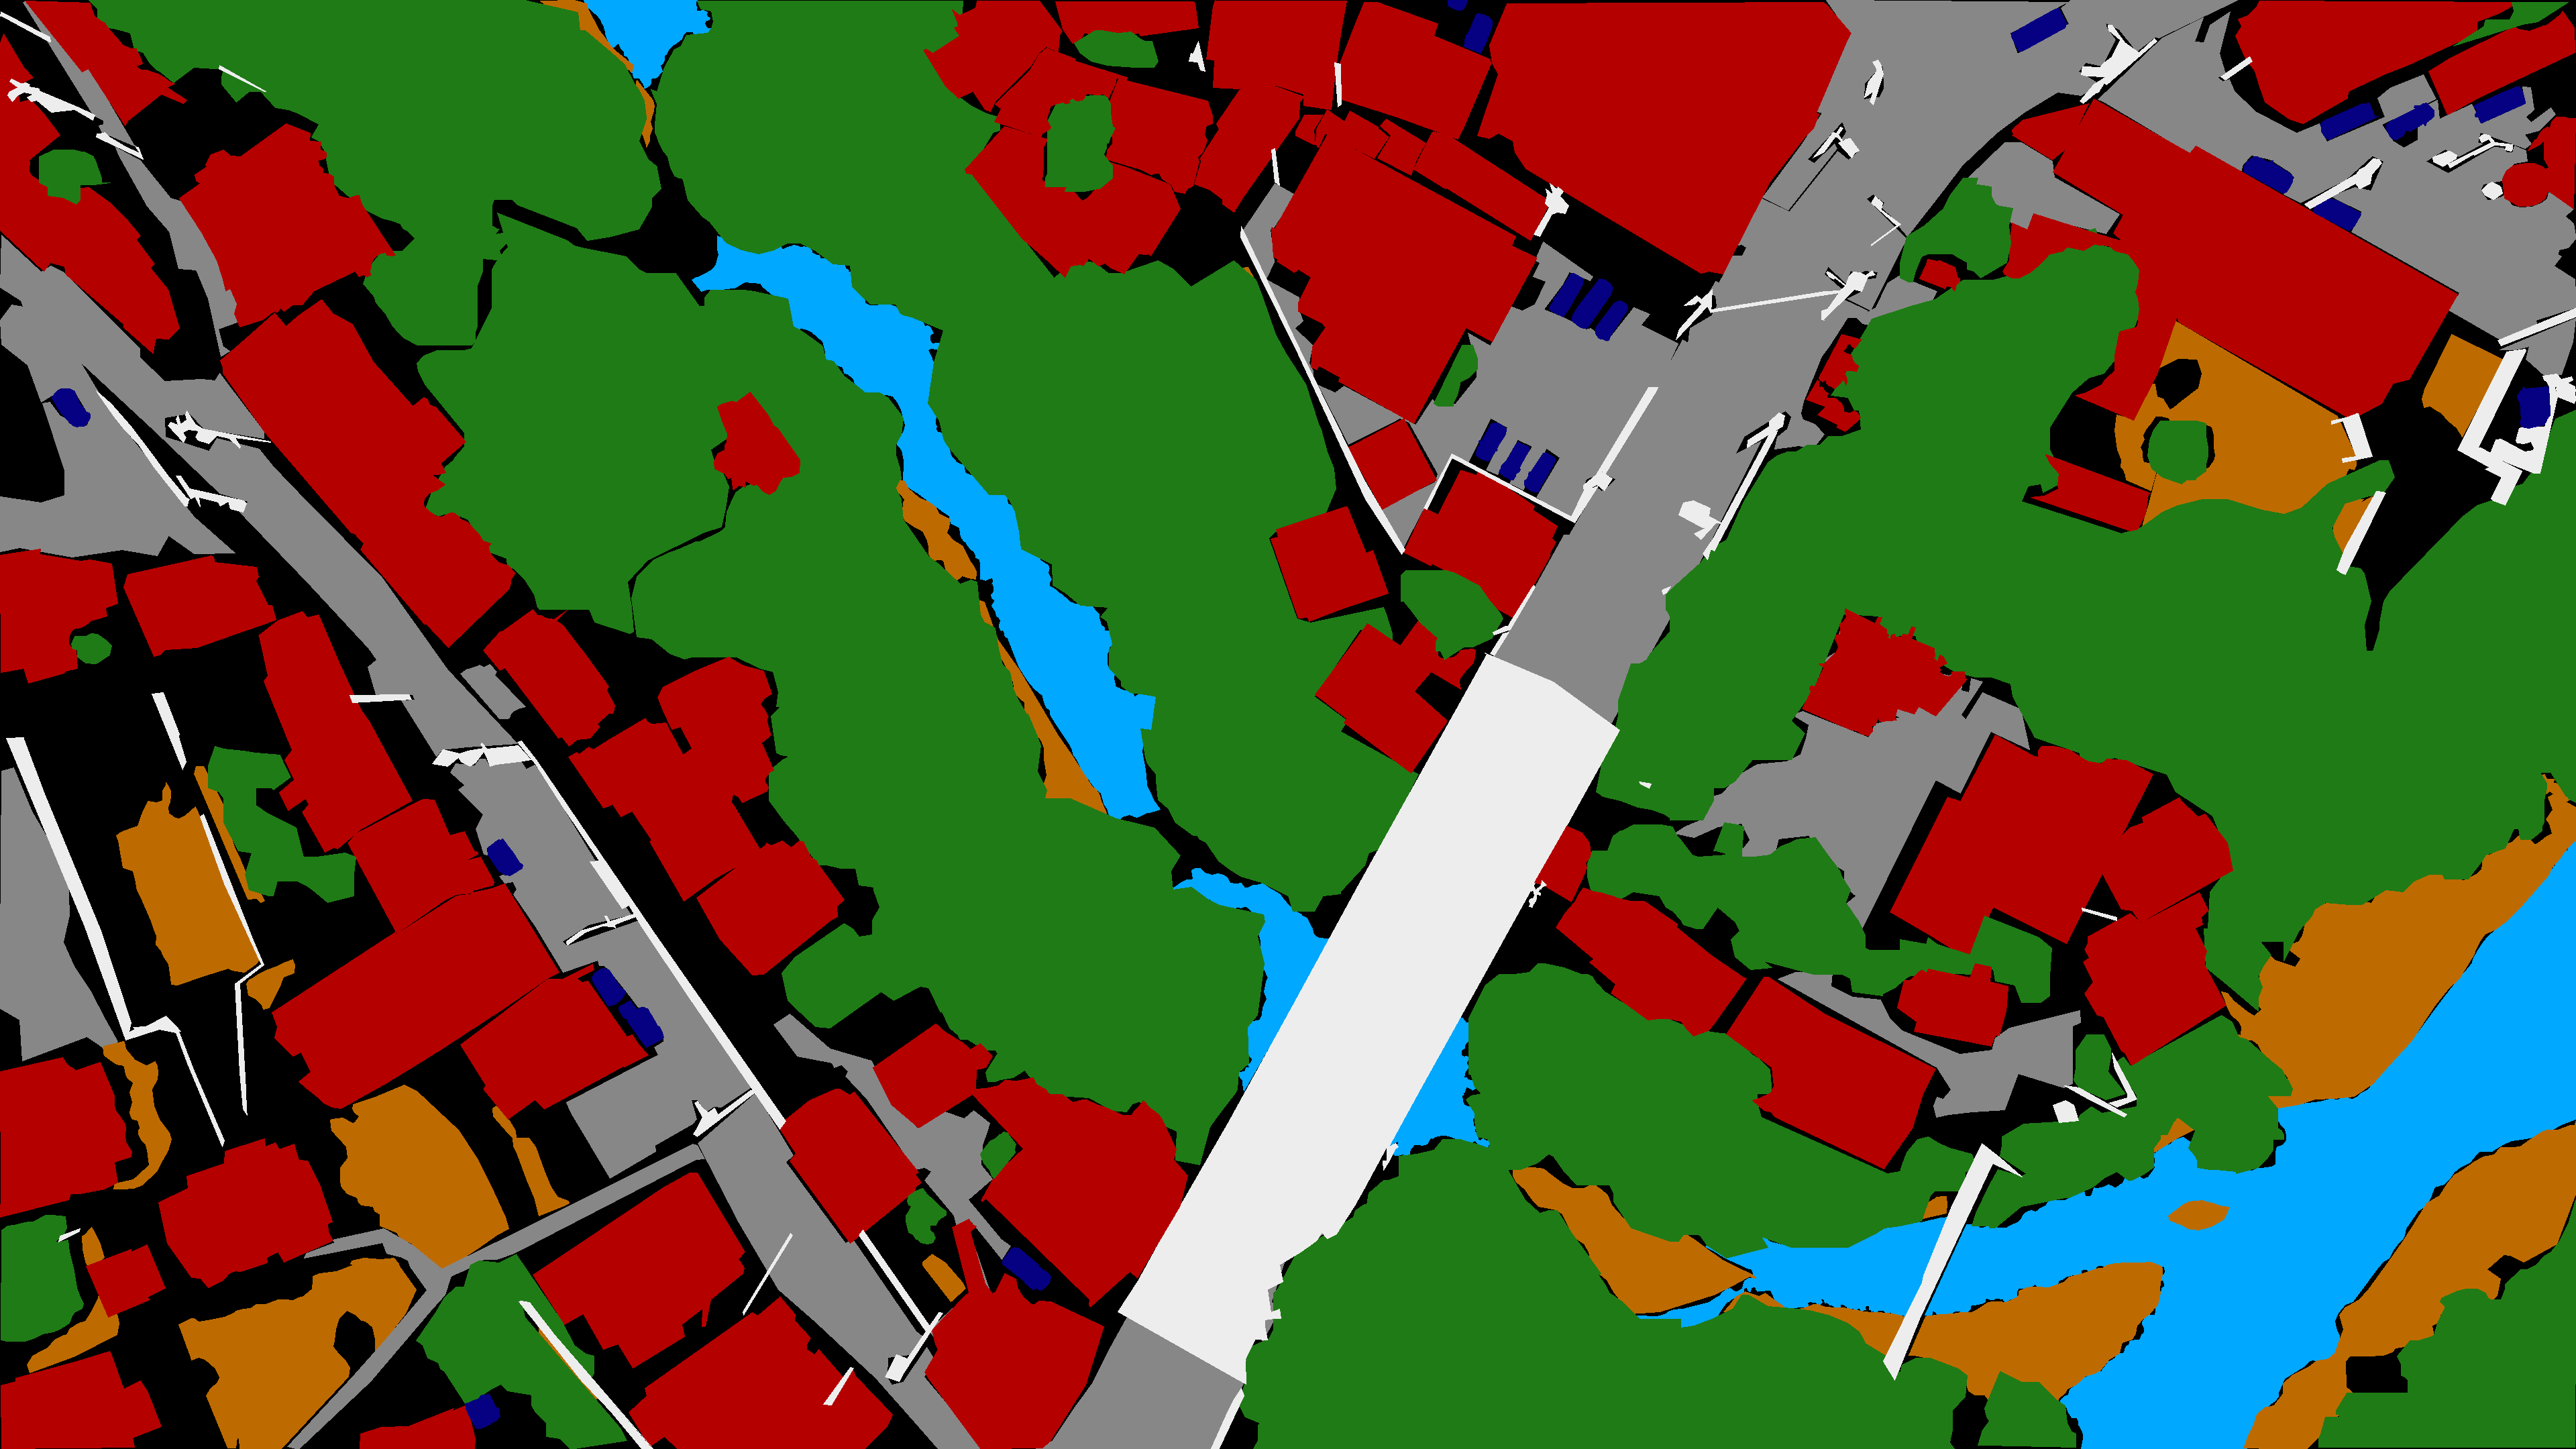
The images have been pixel-wise hand-labeled.
Highlights
- Swiss images captured with a senseFly eBee Classic in 2014 (16MP 4608 x 3456 resolution)
- Okutama images captured with a DJI Phantom 4 in June 2016 (4K 3840 x 2160 resolution)
- Labels are provided in PNG pixel-wise mask files
- 9 different classes
Citation
If you find this dataset useful, please cite the following paper:
Speth, S., Gonçalves, A., Rigault, B., Suzuki, S., Bouazizi, M., Matsuo, Y. & Prendinger, H. (2022) Deep Learning with RGB and Thermal Images onboard a Drone for Monitoring Operations. Journal of Field Robotics, 1- 29. https://doi.org/10.1002/rob.22082
Samples
 |
 |
 |
 |
Label images in this sample were colorized for easy visualization. Actual label files are grayscale PNGs.
Labeled classes
Each class corresponds to a pixel intensity on the label PNG files.
- 0: Background
- 1: Outdoor structures
- 2: Buildings
- 3: Paved ground
- 4: Non-paved ground
- 5: Train tracks
- 6: Plants
- 7: Wheeled vehicles
- 8: Water
- 9: People
Download
Full dataset: Okutama-Swiss-dataset.zip (1.9 GB)
The dataset is split into a training set of 126 images, a validation set of 32 images, and a test set of 33 images.
images/contains RGB images in PNGtrainvaltest
ground_truth/contains labels in PNG- same structure as above
colors.txthas the color scheme used for the samples shown above
Filenames identify the two subsets: okutama_*.png and swiss_*.jpg. For Okutama files, the filenames also indicate the approximate height of flight. okutama_xx_50_yyy.png for 50 meters, and okutama_xx_90_yyy.png for 90 meters. Most images are at 90 meters.
Region subsets
To generate the 12 regions of 2x2 cropped images mentioned in the paper, please use the script makeRegionSubsets.py and corresponding CSV file regions.csv. Place both files inside the dataset folder after downloading and uncompressing, and run the script. The region subsets will be created in the subdirectory regions/.
Authors
The authors are Johannes Laurmaa, Andrew Holliday, Chetak Kandaswamy, and Helmut Prendinger.
The Swiss dataset original images were provided by senseFly.
The creation of this dataset was supported by Prendinger Lab at the National Institute of Informatics, Tokyo, Japan. We are also grateful for the financial support from Matsuo Lab at the University of Tokyo.
License

This work is licensed under a Creative Commons Attribution-NonCommercial-ShareAlike 3.0 Unported License.
If you are interested in commercial usage you can contact us for further options.
Contact: helmut at nii dot ac dot jp